Similar to the majority of the benchmarks we track 3Q21 Performance for Infrastructure PLUS was negative with a total return of -2.6%. The most comparable index, the DJ Brookfield Infrastructure Composite (DJBIA1DOW) also delivered a return of -2.6%. The S&P 500 posted a return of 0.6% for the quarter while the DJ Industrial Average fell 1.9%.
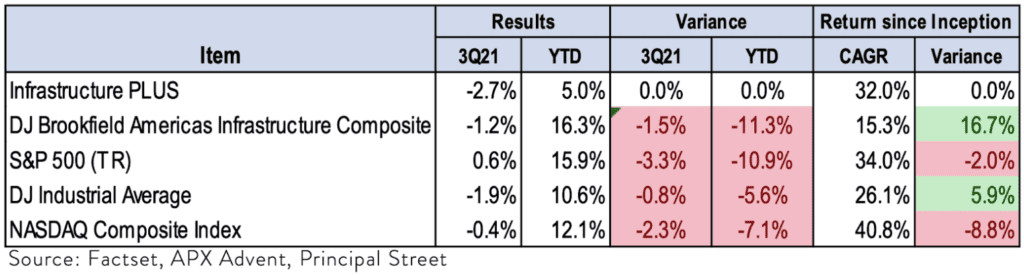
Since the 4/30/2020 inception, Infrastructure PLUS is outperforming the most comparable benchmark by over 1600bp on a CAGR basis, as well as the DJIA by nearly 600bp. PLUS is trailing the S&P500 by ~200bp. Infrastructure PLUS is outperforming all but one of the other infrastructure benchmarks by ~1000bp on a CAGR basis.
What dragged down performance was weakness in the sub-sectors of Renewable Energy which fell over 12% and Telecom which gave up over 9%. On a portfolio weighted basis these two sectors generated ~3% downside. Offsetting the weakness was strength in Environmental Services which gained over 14% and provided 0.9% on a portfolio weighted basis with most of the other sectors relatively flat. Leaders for the quarter were Quanta Services (PWR, +25.7%) and Tetra Tech (TTEK, +22.4%). Laggards for the quarter were concentrated in Renewable Energy with Shoals Technologies Group (SHLS, -21.5%) Sunrun (RUN – 21.1%). Since the end of Q3 Renewable Energy has recovered nearly all of the losses from Q3, already rising 13.1% just three weeks into Q4. Environmental Services has tacked another 9.5% on top of the 14% last quarter. All but one sub-sector is up so far into 4Q, and the total portfolio is on track for its strongest month since June and is up ~6.5%. The infrastructure benchmarks we track are having a strong 4Q as well as they have advanced ~4-7% so far into 4Q.
Outlook: GDP Growth estimates have fallen amid supply chain issues and a resurgent virus though some shortages are creating opportunities
Combined with the lifting of Covid19-related restrictions and multiple fiscal stimulus packages, economic growth has accelerated, and S&P500 EPS estimates had risen as of mid-year. But estimates have come down recently with full year 2021 estimates coming down 60bp, to 5.9% over a resurgent virus, political bickering over mask and vaccine mandates which in turn has contributed to labor shortages and materials shortages throughout the supply chain. Looking out further GDP estimates have held at 4.1% for 2022, risen 20bp to 2.5% for 2023. While a bipartisan group of Senators announced reaching agreement on major issues for a roughly $1 trillion infrastructure package, that legislative package has still not passed amid infighting between Democratic moderates and progressives over a drastically scaled back Build Back Better (“BBB”) omnibus spending package on social programs that was ~$1.8 trillion as of this writing.
Irrespective of the various government spending proposals, Fed policy, and near-term market moves, we believe infrastructure investment, both traditional and modern, has a long runway of growth. We wrote about surging housing starts (highest in 15 years) and record low home vacancy rates (1.0%) opening up infrastructure opportunities with our Q2 update.
We believe energy infrastructure likely to outperform.
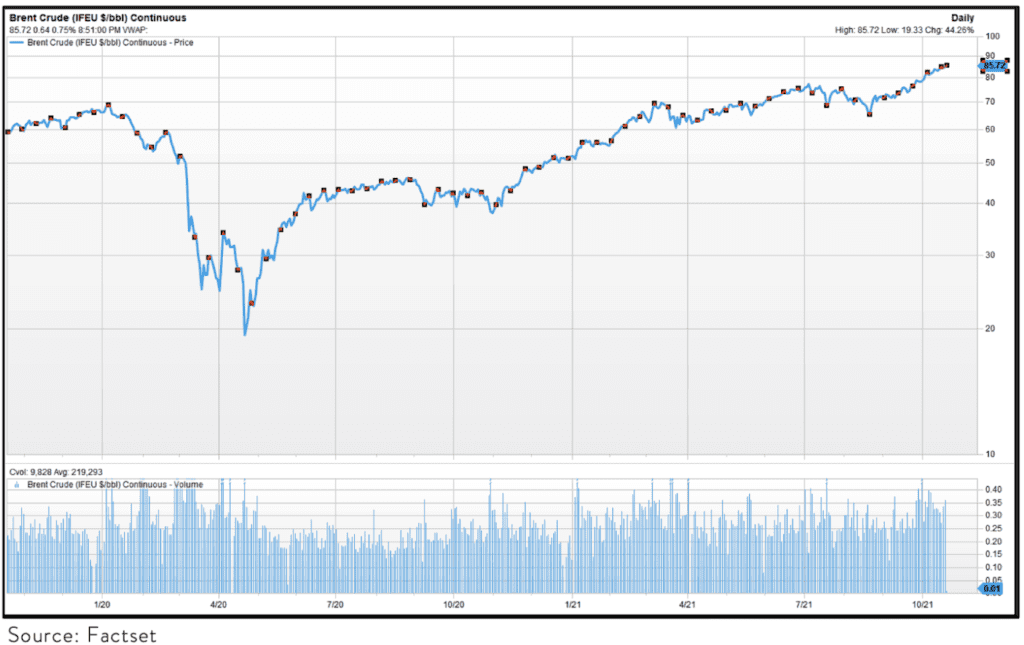
For this update, we are going to cover the growing opportunity in energy both conventional energy infrastructure as well as renewables. While in theory energy infrastructure is supposed to be oil and gas price agnostic, in reality higher commodity prices tend to benefit both earnings as well as stock prices of energy infrastructure companies. Companies with hefty gas processing and NGL fractionation businesses are notable beneficiaries of higher commodity prices. But even companies that are predominately pipeline transportation plays can benefit from higher commodity prices. Higher oil and natural gas prices can lead to sanctioning of production projects that in turn leads to more volumes flowing on the pipelines. In turn, more volumes on pipelines means higher earnings which translates to better returns for investors. The key question becomes: Where are oil, gas, and NGL prices headed? We believe that commodity price risks skew to the upside and are likely to remain elevated going forward. The main reason is that global oil inventories are now well below average. We believe that global inventories are likely to head even lower boosting prices even further. Specifically, based on the work of our friends over at Cornerstone Analytics (“CA”) global oil inventories since July 2020 have drawn down by a record 444mm barrels. That record draw down has taken OECD crude oil inventories down from a record 3.225 billion barrels in July 2020, to an estimated 2.775 billion barrels at the end of the 3rd quarter. The 2.775 billion barrels compares to the 7-year global average inventory for the end of the 3rd quarter of ~2.95 billion barrels. Back in July 2020 inventories were ~250mm barrels above average and now inventories sit ~200mm barrels below the 7-year average. By way of the relationship between inventories and oil price, CA has done extensive regression analysis and find that oil prices move by ~$7 for each 50mm barrel change in OECD global inventories. The translation from the inventory change has been about $60-$65/barrel in the price of oil. Brent bottomed at ~$19/bbl in April 2020 and now sits at ~$85/bbl or ~$66/bbl higher and in line with the rule of thumb predicted by CA models.
One of the key questions is with oil prices as high as they are today, shouldn’t there be a supply response by both OECD (translation: US) producers as well as OPEC? The answer is yes. But we believe that supply is more likely to lag demand, at least in the near to intermediate term. The reason why we believe supply is likely to lag demand is based on the following:
1) Greater regulation. US producers continue to get a lot of pressure from government policymakers and regulators. Regulators and policymakers do not want producers to ramp up production too rapidly for environmental reasons (read: climate change) and also so that renewable energy can be more competitive vs. fossil-based energy. Moreover, further discouraging producers, the Federal government suspended new leases on Federal lands. According to a Recent WSJ article, the U.S. Department of the Interior approved only 171 drilling permits on Federal lands in August, which was 75% lower than in April. But as the article points out there are a number of other hostile policies. For example, ironically the current Administration is reviewing Alaska’s National Petroleum Reserve to make it off limits to petroleum. Financial regulators are considering imposing new rules related to climate risk to increase the cost of capital on the oil and gas industry as well as restricting access to sources of funding. Even the Federal Energy Regulatory Commission (FERC), which has the authority to approve new natural pipelines has indicated that even minor projects such as adding compressor stations, will be required to include environmental impact statements or as the column points out effectively turning the FERC into a Climate Commission. The irony is that the harsh regulatory climate ends up benefiting the incumbents and driving oil and gas prices even higher. By discouraging investment in oil and gas, production is much less likely to get back to 2019 levels and be less likely to be able to meet demand that has already reached 2019 levels.
2) Shareholder pressure to incentivize return on invested capital over production. Shareholders have also been pressuring management teams for a number of years to change compensation incentives to be based on return on invested capital instead of production targets. Most boards of oil and gas producers have made this change in compensation incentives. As a result, oil and gas producers have been far more disciplined with the way they allocate capital (translation: much less capital being spent). According to data collected by Cornerstone Analytics the accumulated reduction in capital spending from the 2014 peak to the estimate for the end of 2021 is ~$2.2 trillion.
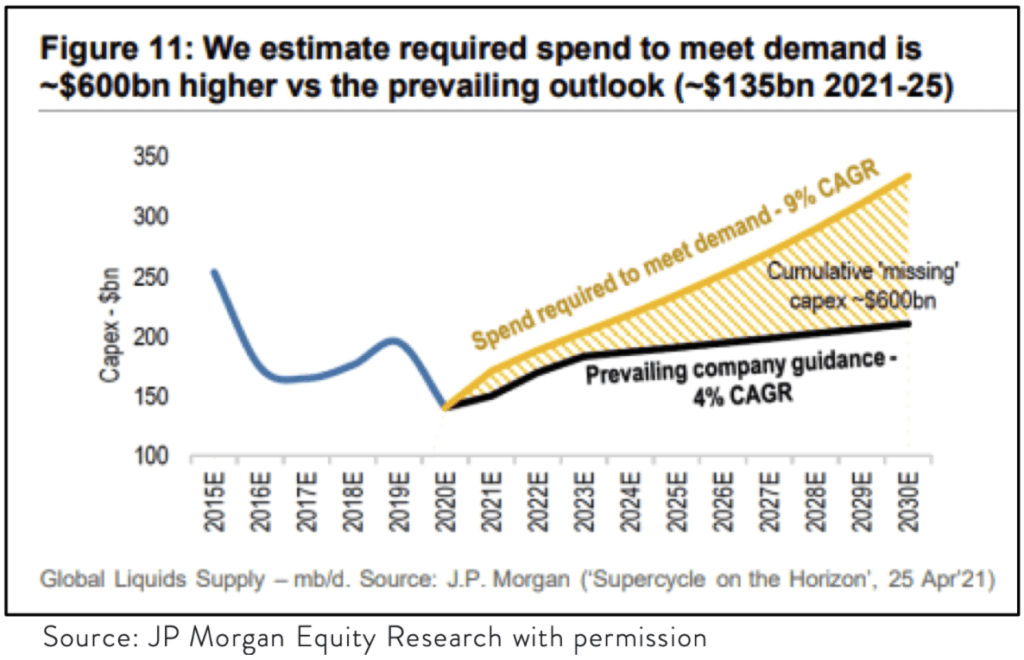
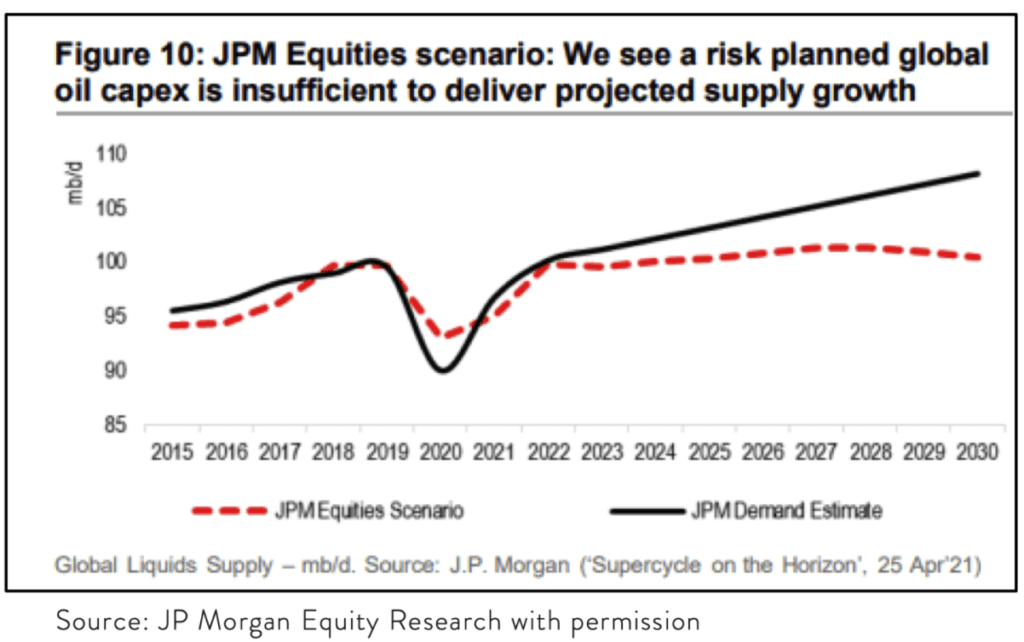
Taking the thesis on underinvestment in production even further, JPMorgan argues that the investment shortfall, if anything, is likely to get worse over the rest of the decade as shown in their Figure 11 below. As a result, the wedge between demand and supply is likely to grow. JPMorgan also shows in a separate analysis that compared to December 2019, North American majors cap ex spending from 2021-2025 is forecast to be lower by a cumulative $130B or down by an average of ~1/3 vs the December 2019 cap ex plans.
3) Improved OPEC discipline. OPEC has consistently indicated that it would rather that the supply/demand balance lean toward being too tight. OPEC production capability stands at 30.55 mm bbl/d. Even if production ramps from the ~27.5 mm bbl/d estimated 4Q21 production and hits max capacity of 30.55 bbl/d by 2Q22 with global demand expected to reach a little under 101mm bbl/d by end of 2022, there is likely to still be an incremental draw in 2022 of ~275-300 mm/bbl. CA’s rule of thumb of $7/bbl price impact for every 50mm barrel change in inventories. CA’s forecast draw for 2022 would then imply that by the end of 2022, the price of Brent could reach ~$135-$150/bbl (we calculate $145/bbl).
Bear in mind that this is the price pessimistic case (i.e., lower Brent oil prices) not the base case. In CA’s base case, OPEC would not reach full production capacity until 4Q22. Using the base case, the draw on oil for 2022 would average ~1.75mm bbl/d and would result in Brent prices more than doubling from current levels by the end of 2022, to ~$195/bbl.
For the sake of conservatism, we will assume that the price of Brent reaches triple digits by 1H22 at which point Riyadh ramps up its production capabilities to obtain a targeted Brent price of $90- $100/bbl. The point of the discussion is that given OPEC continuing to maintain discipline, even in the face of a US Presidential request, the outlook for oil prices is higher which should continue to benefit not only the E&P sector but energy infrastructure as well.
4) Energy demand is likely to be higher than what the consensus believes in our view. Something to bear in mind is that the estimate is more bullish on oil than consensus. The reason for this has to do with so called missing barrels. As CA points out, most forecasts are repackaged work done by the IEA. However, the IEA has consistently underestimated demand.
IEA estimates oil demand from a model tied to global GDP. But 96% of oil demand growth over the last 2-3 decades has come from emerging market countries where GDP data and oil consumption data is less accurate and less available. As a result, the formula used by the IEA has consistently underestimated demand relative to the calculations that CA does based on the actual consumption of oil which is pointed out in the equation below.
Demand can be estimated by backing into apparent demand based on supply combined with OECD inventory data which is fairly accurate and reasonably well disclosed. Non-OECD inventories have little if any discretionary inventories. Apparent demand can then be estimated:
Demand = Production +/- inventory change.
The reason this is important is that if the IEA underestimates demand, then it will tend to overestimate future oil inventories leading them to underestimate the future price of oil.
Coming back to the near term, the result of the so-called missing barrels is that CA estimates that during the 4Q21, demand is likely to outstrip supply by 2.2mm barrels/day. Multiplying that figure by 92 days in the quarter and we can calculate a draw for 4Q21 of ~200mm barrels. Based on the CA rule of thumb suggest that the price of Brent should go higher by ~$28/bbl and reach ~$100-$110/barrel from the $78/bbl Brent price at the end of 3Q. But to be more conservative, we assume Brent gets to only $92/bbl by the end of the year. (I have a wager for a dinner with one of my very smart energy analyst friends that Brent exits the year above $92/bbl).
The result of this work is that our bias is to raise further our allocation to energy infrastructure yet again as it appears to be in position to continue to outperform even as it has significantly outperformed so far. Moreover, there are not the supply chain issues that have held back renewable energy this year and could continue to create a headwind for renewable energy relative to conventional energy infrastructure. That said, we continue to be overweight renewable energy along with conventional energy infrastructure as the rising cost of oil and gas tends to make renewable energy more competitive.
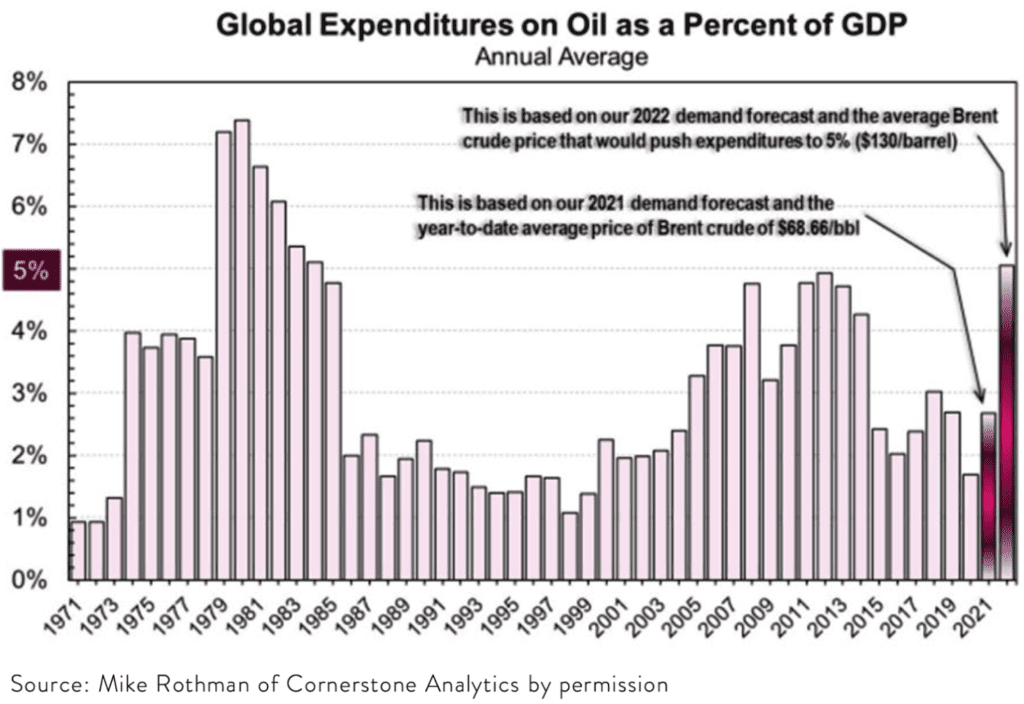
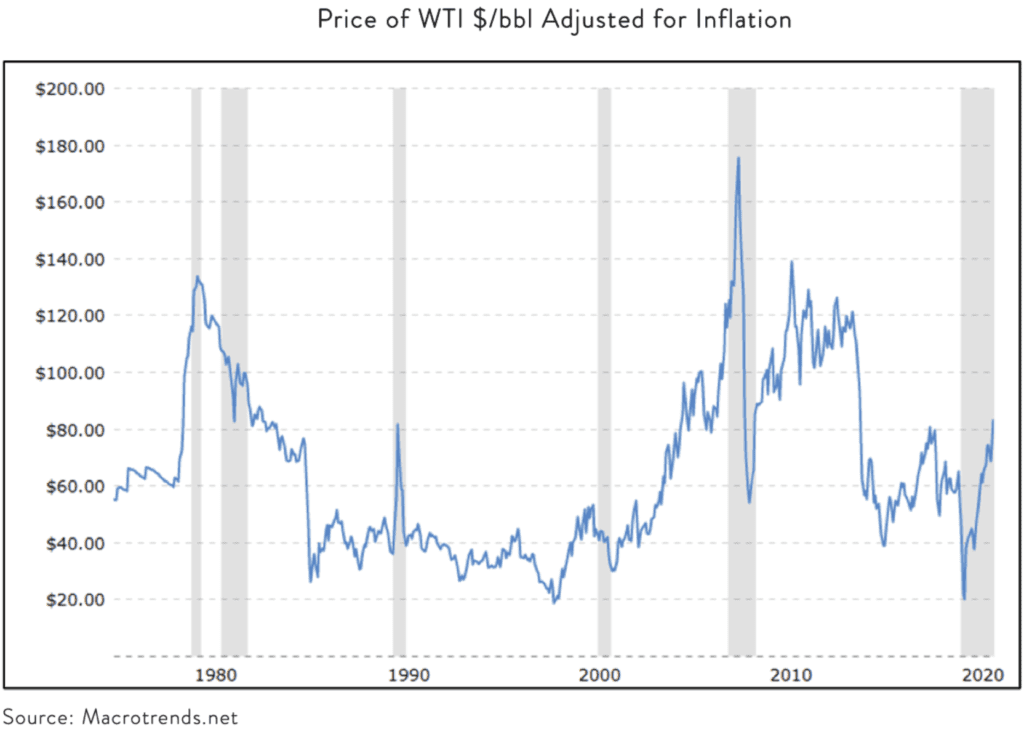
The positive price outlook is all well and good but as many analysts, investors, and others point out, what if oil prices wind up being “too high?” Put another way, oil prices have a long history of volatility with increased production/lower demand eventually responding to higher prices with the lag in such supply/demand responses contributing to such volatility. That raises the question of what is such “too high” price for oil that negatively impacts demand? That would be the price that negatively impacts demand which turns out to be where oil-related spending exceeds 5% of GDP according to our friends at CA who have studied this issue for decades. That price would currently equate to ~$130/bbl. So how is the ~5% of GDP the inflection point? In the 1980-1982 period when global expenditures on oil reached as high as 7.5% of global GDP, inflation rose to double digit levels in the US, and the Fed had to crank up interest rates to double digit levels to put the brakes on inflation and those that have been around a while will recall that a severe recession ensued which in turn ultimately sent oil price plummeting. There were similar events in the 2007-2008 period, though that was also accompanied by massive speculation in real estate and mortgage-backed securities, and again when crude peaked in the 2012-2014 time period which was accompanied by the OPEC decision to try to put US shale producers out of business by flooding the world with crude oil instead of their traditional role of effectively being the global central bank of oil. But what is interesting is that each time global expenditures as a % of oil reached to the 5% level, a crash in crude oil prices followed for whatever reason whether it was spreading inflation with a subsequent reaction from the Fed, triggering a response from Riyadh, etc. Also, what is interesting is how well the chart of the price of WTI crude oil (adjusted for inflation) correlates with the chart of global expenditures on oil as a percent of GDP.
There is a long way to get to $130/bbl price and there are a lot of moving parts in terms of even getting to $100/bbl. However, OPEC has done a solid job of maintaining discipline in the current environment. Swing production from the US has not exactly come back very strong. As we mentioned earlier, US producers are now incentivized based on returns, not production. US policy also currently discourages production as there are moratoriums in place for leases on Federal land. Producers of oil and gas are also discouraged on ESG grounds and encouraged to redirect investment towards renewable energy. In effect, ESG initiatives have turned into tailwinds for oil and gas producers and by extension infrastructure players. Further, shareholders have been very active in encouraging management teams to prioritize capital discipline and not revert to past practices of over production which resulted in destroying capital.
Portfolio Insights
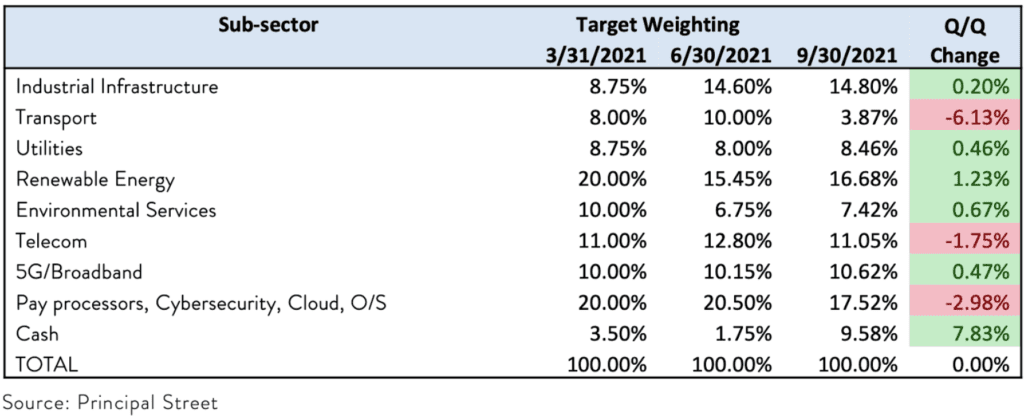
As mentioned above the sub-sector with the greatest return was Environmental Services which returned ~15% during the quarter. The largest drag was Renewable Energy, declining 12.7%. Telcom was the other drag on performance, dropping ~9.1%. We made changes to the target sector weighting as indicated in the table below. The most significant change in the weightings was the lower weighting in Transport and Pay Processors, Cybersecurity, Cloud. We maintained a higher-than-normal level in cash over market valuation concerns, seasonality, and policy. In those names where positions were reduced, they underperformed. We would have done better to reduce weightings in Renewable Energy and Telecom. On Renewable Energy, supply chain and logistics were a known headwind, and it appears the correction was overdone as four weeks into the 4Q, the drop has been recovered and then some as sub-sector return is ~23% to date. Industrial did not perform as well as expected but we view the 1.5% loss on the quarter as temporary given the tailwinds in energy that we have described above, and that assessment has been proven correct as the sub-segment is up nearly 16% just four weeks into the 4Q.
As we have mentioned in the past, the renewable energy share of the total generation mix is expected to grow from 17% in 2019, to 38% by 2050, leading all sources for electricity generation. Solar energy is expected to grow from 15% of the renewable energy mix in 2020 to nearly half by 2050 or ~17.5% overall. This expansion of solar translates to growth in the US microinverter market by about one-third over the next 5 years and the US battery storage market is expected to triple over the next 5 years.
The global solar inverter market is expected to grow from ~$17B-$20B currently to $45B by 2025 and the leading publicly traded microinverter players have less than 15% of the global market. These statistics underscore what we hear on company quarterly conference call updates where demand is very strong and not the issue. Near term supply constraints have been the issue. The result of the steep valuations and supply constraints resulted in the Solar falling by 10.5% during the 3rd quarter, the Global Clean Energy falling ~7.7% during the 3rd quarter and as mentioned earlier, our renewable energy allocation delivering a negative ~12.7% during the 3rd quarter. The rebound over the last four weeks has been impressive with the Renewable allocation up 23% in our Infrastructure PLUS, the Solar benchmark up 10.3%, and Global Clean Energy benchmark up 8.6%, recovering the downside from Q2.
Telecom has had rough sledding of late. The sub-sector contains a number of value plays (though they feel like value traps lately). For example, Vodafone (VOD) shares trade at just 11x FY2 EPS and a PEG of just 0.5x based on FY2/FY1 estimated EPS growth despite a yield of nearly 7% for good measure. None- the-less VOD shares have underperformed with a nearly 10% price drop during Q3 following a 7% price drop in Q2. We were optimistic as it staged a 10% advance midway into 2Q only to be followed by a 15% decline from the 2Q peak.
T-Mobile US, Inc (TMUS) trades at ~35x 2022E EPS. Going forward, its EPS outlook is for 50% CAGR through 2024. The PEG based on the EPS growth next year is 0.76, falling to 0.32 for 2023/2022. None-the-less, TMUS shares have continued to get beaten up. While it posted a 15.6% gain in 2Q21, TMUS shares followed with a 11.8% decline in 3Q and a decline of nearly 9% so far in 4Q. Analysts refer to AT&Ts aggressive upgrade stance, managing through the churn from the Sprint merger, the data breach in 3Q, more aggressive wireless promotional environment including TMUS’s, the DISH mobile virtual network operator (MVNO) agreement with AT&T on TMUS 2022 EBITDA guide, timing of Sprint cell site decommissioning, and whether share buy backs begin in 2022. Nonetheless, it would seem that these headwinds are more than priced in TMUS shares. Opportunities/tailwinds are the Sprint merger synergy progress, market share gain in fixed wireless, rural, and enterprise, wireless network prices well below AT&T and Verizon, and potential for $60B in stock buybacks the next 5 years compared to TMUS current market capitalization of $145B. More to follow on this in future published articles.
Infrastructure PLUS Strategy
We set out to create a portfolio of infrastructure companies that would enable investors to achieve the capital preservation, stability, and lower volatility desired from traditional infrastructure strategies but without sacrificing long-term total returns.
In our research we found that many available public equity infrastructure strategies (both ETFs and mutual funds) have not performed as intended or desired. The premise behind many of these strategies is that, in exchange for giving up performance on the upside during bull markets, infrastructure investments should perform better on the downside during periods of market volatility. Instead, what we found is that over the long term listed infrastructure strategies simply lagged broader markets, even during certain downturns. This finding was born out during the onset of and recovery from the recent COVID-19 global pandemic.
Adding sub-sectors that are critical to driving a modern economy such as cyber security, payment processing, broadband, cell towers, renewable energy in addition to traditional infrastructure such as utilities, railroads, pipelines, and telecom, we found that there was a better chance of achieving intended infrastructure performance.
Please feel free to reach out with any questions.
John Edwards, CFA
Download a PDF of this commentary here.
IMPORTANT DISCLOSURE INFORMATION
This commentary is provided for informational purposes only and contains no investment advice or recommendations to buy or sell any specific securities. The statements contained herein are based upon the opinions of the Portfolio Management team and the data available at the time of publication of this report. Any sectors or securities mentioned are based on newsworthiness and may or may not reflect holdings in any Principal Street portfolio. The reader should not infer that any securities discussed were or will be profitable. Information was obtained from third party source s believed to be reliable, are not necessarily all inclusive, and are not guaranteed as to accuracy. Past performance is no guarantee of future results and there is no assurance that any predicted results will actually occur.